Indonesia Oil Palm
Oil palm is one of the most efficient crops in terms of production per unit area (de Vries et al. 2010). About ca. half of global palm oil production comes from Indonesia. Oil palm is grown in ca. 12 million rainfed hectares (ha). Average annual oil palm yield in Indonesia is ca. 18 t fresh fruit bunch (FFB) per ha year (Directorate General of Estate Crops; 2012-2017). Oil palm represents the major source of revenue for this country, and perhaps more importantly it provides profitable livelihoods for smallholders, which account for 41% of total oil palm area in Indonesia (Jelsma et al, 2017). In the case of the atlas for oil palm in Indonesia, we focused on existing plantation area located in mineral soils, which represent 85% of total oil palm area. Because most oil palm area in Indonesia is rainfed, we used water-limited yield potential as the relevant benchmark to estimate yield gaps.
Data sources and assumptions (following GYGA protocols)
Weather data and reference weather stations
Based on oil palm area distribution on mineral soils (Forestwatch, 2018; https://www.globalforestwatch.org/map) and the agro-climatic zones defined for Indonesia (Van Wart et al., 2013), a total of 22 sites were selected (Figure 1). Surrounding oil palm area to the selected sites (‘buffers') account for 59% of national oil palm area in mineral soils, while the agro-climatic zones where the sites were located account for 91% of national area for this crop. Daily weather data, including solar radiation, Tmax, Tmin, and rainfall, from the last 28 years (1990-2018) were retrieved from BMKG meteorological weather stations (http://dataonline.bmkg.go.id/home). Measured weather data were not available for eight sites; in those case, we used NASA-POWER gridded weather data (NASA-POWER; NASA, 2012). Quality control and filling/correction of weather data was performed based on correlations between the target meteorological station and one to three adjacent weather stations following van Wart et al. (2013). Number of corrections/filled data was always < 3%.
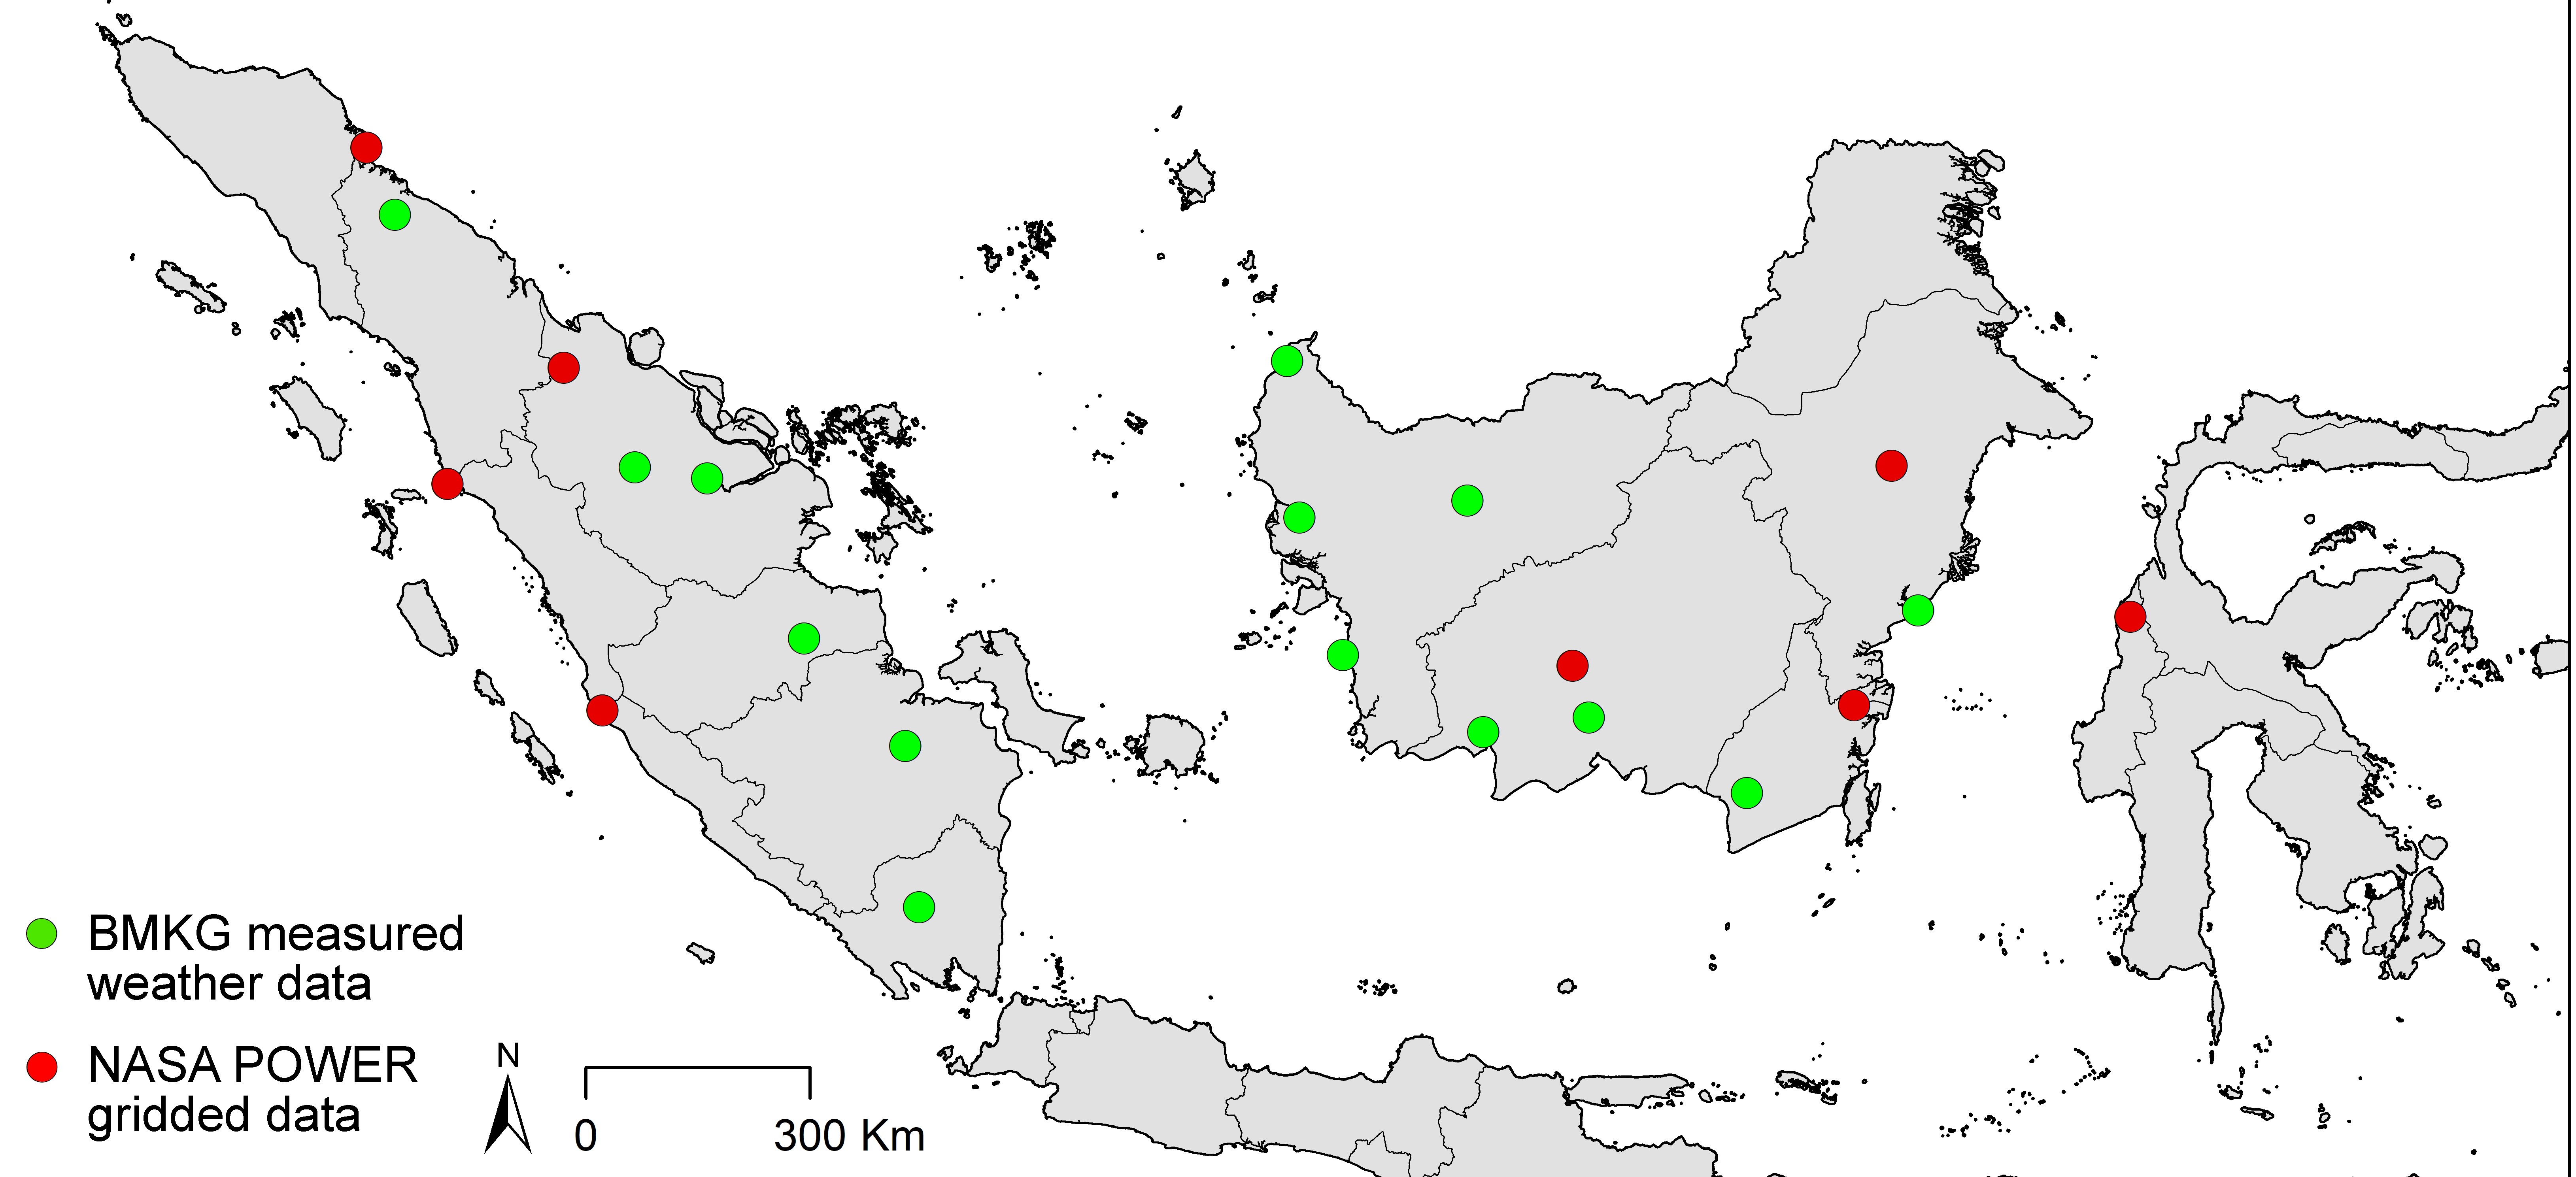
Figure 1. Selected weather stations and associated source of weather data for developing the atlas for oil palm in mineral soils in Indonesia.
Soil data
A soil map was overlaid with the buffer zones to identify the dominant mineral soils where oil palm is currently produced (Forestwatch, 2018). Soil texture, soil depth, and slope for dominant soils identified in each buffer were derived from soil maps at scale 1:250,000 from the Indonesian Center for Agricultural Land Resources Research and Development (2012). In all cases, selected soil(s) accounted for >60% of total oil palm area in mineral soils within each buffer. Pedo-transfer functions for tropical soils were used to retrieved upper and lower soil water retention limits. In absence of soil constrains, we assumed a maximum soil depth for soil water extraction of 1.5 m.
Harvest area and actual yields.
Regency-level data on crop harvested area and average yields for each crop were retrieved from official national statistics (2012-2016; Directorate General of Estate Crops; http://www.pertanian.go.id/). Available data were already disaggregated by farm type: large plantations (>25 ha) and smallholders (<25 ha). Large plantations included both private and state (government-owned) plantations. We did not attempt to differentiate them given the similarity in yield and management practices and the small area of state plantations (ca. 10% of national oil palm area). In the case of smallholders, they can be classified into supported and independent smallholders, depending on the mode of engagement with large plantations. Supported smallholders typically engage in a contract with a large plantation, with a large scale plantation (‘nucleus') surrounded by oil palm smallholder plantations (‘plasma'). In contrast, independent smallholders operate without any form of support (Molenaar, 2013). Yields are substantially lower in independent versus supported smallholders (Euler et al., 2016). Unfortunately, current official statistics are not disaggregated into supported and independent smallholders; instead, statistics are reported for the pooled smallholder category.
For each year and farm typology, a weighted average actual yield for productive plantations was calculated for each buffer based on the harvested area in each regency that overlap with the extent to the buffers. For the calculation of actual yield in a given buffer, we only included regencies that have >30% of their total area inside a given buffer. Data from large plantations in 2016 were not available; hence, for that year, we estimated yields for large plantations based on smallholders yields in 2016 and the yield ratio between large plantations and smallholders in the previous four years (2012-2015). Official statistics on actual yields do not differentiate among mineral soils and peatlands. Because actual yield is typically lower in peatlands, our actual yields may be underestimating the actual yield in mineral soils. However, we note that peatland share of national oil palm area is only 15%; hence, the bias in the estimation of actual yield and yield gap is expected to be small.
Management information for crop simulations
Management practices, including plantation age, were retrieved for each site and plantation type (smallholder and large plantations) and buffer from local oil palm agronomists and researchers. Average plantation age is relevant for estimating yield gap as it influences the water-limited yield potential. Hence, for robust estimation of yield gap in oil palm, it is important to know what the average age of the plantation for each buffer and farm type is, so that the actual average yield can be compared against the corresponding water-limited yield at the same age. Other oil palm agronomists further corroborated data on average plantation age.
Model simulations
Simulations were performed using PALMSIM v2.0 model, which is a modified version of PALMSIM v1.0 (Hoffman et al., 2014). The model provides estimates of yield potential and water-limited yield potential on a field scale at a daily time resolution and is driven by climatic variables. PALMSIM v2.0 is coupled to a water balance having precipitation, evapotranspiration and drainage as main fluxes. A transpiration reduction factor in combination with the incoming radiation and a light use efficiency is determining the amount of assimilates produced. Subsequently, assimilates available for plant growth are partitioned to the vegetative (roots, trunk, fronds) and generative part (male/female inflorescences) based on age dependent potential growth rates, which determine the sink strength of a certain organ. The ratio between supply and demand (potential growth rate) as suggested by Combres et al. (2013) is used to simulate yield determining mechanisms like male/female inflorescences ratio, bunch abortion and bunch failure.
Model calibration and validation
Model calibration and validation was performed using monthly fresh fruit bunch yield, bunch number and average bunch weight data from high-yielding commercial plots and experimental trials provided by commercial plantations in Sumatra and Kalimantan. These blocks were explicitly selected to portray well-managed plantations across a wide range of soil and climate conditions. Average annual yield ranged from 18.2 to 41.6 t FFB per ha per year for matured plantations (>10 years) across sites and years. On-site soil and weather data provided by the plantations were used for model simulations. In those cases where weather data were not available (or were incomplete), we used data from the nearby weather station or NASA POWER gridded weather data if there was no nearby weather station. For the simulations, no limitations to crop growth by nutrients or biotic stress were assumed and planting density and configuration were set according to recommended best practices (141 palms per ha and an optimal frond count of 50 and 40 for young and matured plantations, respectively). Four commercial plots were randomly selected for model calibration. First, a boundary line analysis was performed to obtain potential bunch weights at different palm ages. The remaining parameters were calibrated in a subsequent step using the same subset of (four) blocks. Subsequently, the model (with all calibrated parameters) was validated against the remaining blocks.
Model simulations
For the 22 sites, potential and water-limited yield potential were simulated (though as mentioned previously, water-limited yield potential was used as benchmark to estimate yield gaps). Commercial plantations are usually replanted every 25 years; hence, for each buffer, we simulated yield potential and water-limited yield potential for the entire 25-year plantation cycle. For a given plantation age, potential and water-limited yield potential can still vary because of variation in weather. To account for weather-driven variation in potential and water-limited yield at a given palm age, multiple 25-year simulations were performed for a given buffer using the same weather data but with different arrangements. Briefly, we started the 25-year simulations at different years (filling the missing years at the end with the early years of the weather file if needed). We performed these (25-year) simulations of the plantation cycle starting in 28 different years; hence, for a given plantation age, we had 28 values estimates of yield potential and water-limited yield potential (Figure 2).
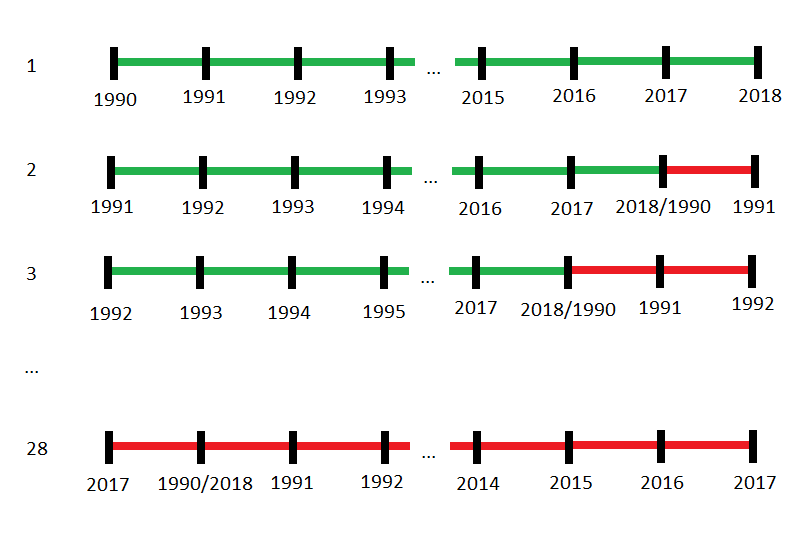
Figure 2. Scheme illustrating estimation of yield potential and water-limited yield potential using different sets of weather data to account for variation in potential yield at a given plant age due to weather variation.
Average potential and water-limited yield (and their respective coefficients of variation) were calculated for each palm age in each buffer. In the case of water-limited yield, separate simulations were performed for each selected mineral soil type, which were subsequently aggregated based on the share of each soil to the total oil palm area within the area. For each buffer and farmer typology (smallholder and large plantation), the yield gap was calculated as the difference between the water limited yield potential and actual yield (Figure 3). In the case of water-limited yield potential, we used the value from the palm age that corresponded to the one reported for the specific buffer and farmer typology. Hence, yield potential and water-limited yield potential varied (slightly) between farmer typology due to difference in average palm age. We acknowledge that the yield gap for plantations in mineral soils is slightly overestimated as official statistics does not disaggregate yield into mineral and peatland soil, with the latter typically exhibiting lower yields. As mentioned earlier, peatlands only account for a relatively small portion of national oil palm area (15%); hence, it won't likely bias our estimates of yield gaps. In the case of smallholders, the yield gap will be underestimated and overestimated in the case of independent and supported smallholders, respectively; we expect the yield gap to be substantially larger in the former category. Unfortunately, official statistics are not available in order to disaggregate the yield gap estimation by type of smallholder.
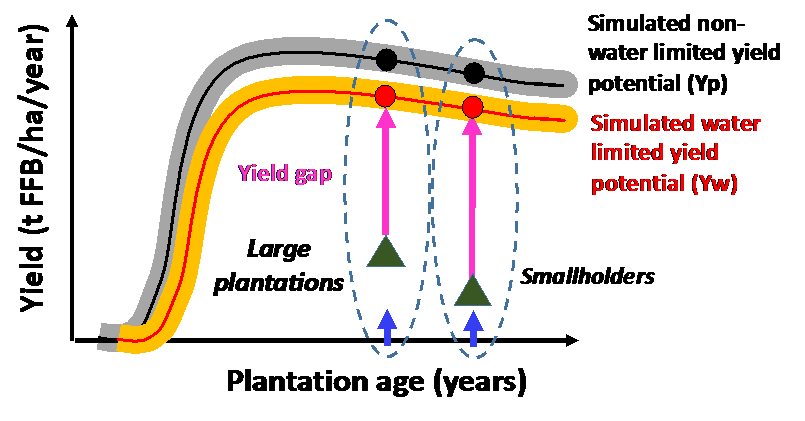
Figure 3. Scheme showing estimation of the yield gap for large plantations and smallholders.
In addition to the atlas, an interactive tool was developed (http://www.yieldgap.org/gygagraphs/index.html) to display patterns in yield potential and water-limited yield potential over time. The tool is schematically shown in Figure 4. The tool can be used to determine the yield potential and water-limited for a given plantation age for a given site and soil type. Patterns are displayed for different levels of spatial aggregation (buffer, climate zone, country). It shows oil palm yield (in FFB) as a function of plantation age, with lines representing average potential yield (black line) and water-limited yield potential (red line) for the entire 25-year plantation cycle. Associated bands represent the standard deviation, which gives an idea of yield variation due to the weather variability. Achieving 70% of the water-limited yield potential is a reasonable upper goal for plantations with good access to markets, inputs, and extension services. The attainable yield (blue line) can be used as a reference to benchmark current productivity level. The exploitable yield gap is defined as the difference between the actual yield and attainable yield and represents the room for improving productivity on existing plantation area through adoption of good agronomic practices.
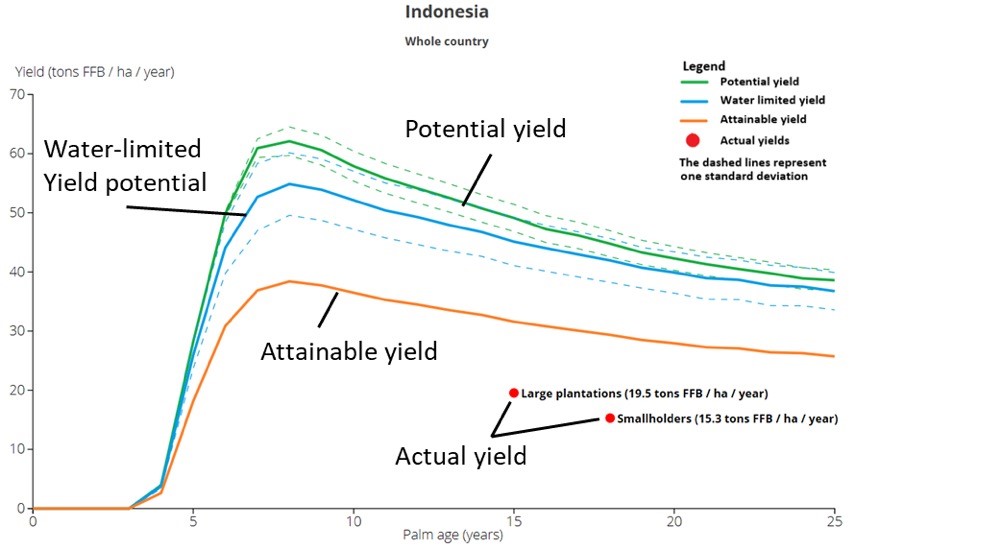
Figure 4. Scheme showing the interactive tool available for users, which allows estimation of yield potential, water-limited yield potential, and attainable yield (70% of water-limited yield potential) for any given buffer-soil-palm age combination. These estimates are also available for higher levels of spatial aggregation (climate zone and country). Average yields for large plantations and smallholders are also shown. Dashed lines indicate the standard deviation for potential yield and water-limited yield potential.
Acknowledgements
We are thankful to the personnel at the former International Plant Nutrition Institute (SE Asia office) and a number of plantation companies for providing productivity and management data from a number of well-managed blocks across the Indonesian archipelago for model calibration and evaluation. We are also grateful to large plantations and smallholder farmers' associations for their support to the project.
References
Juan P. Monzon, Maja A. Slingerland, Suroso Rahutomo, Fahmuddin Agus, Thomas Oberthür, José F. Andrade, Antoine Couëdel, Juan I. Rattalino Edreira, Willem Hekman, Rob van den Beuken, Fandi Hidayat, Iput Pradiko, Dwi K. G. Purwantomo, Christopher R. Donough, Hendra Sugianto, Ya Li Lim, Thomas Farrell and Patricio Grassini, 2021. Fostering a climate-smart intensification for oil Palm, Nature Sustainability: https://dx.doi.org/10.1038/s41893-021-00700-y
Combres, J. C., Pallas, B., Rouan, L., Mialet-Serra, I., Caliman, J. P., Braconnier, S., Soulie, J., & Dingkuhn, M. (2013). Simulation of inflorescence dynamics in oil palm and estimation of environment-sensitive phenological phases: a model-based analysis. Functional Plant Biology, 40(3), 263-279.
de Vries S. C., Van De Ven G. W., Van Ittersum M. K., Giller K. E. (2010). Resource use efficiency and environmental performance of nine major biofuel crops, processed by first-generation conversion techniques. Biomass Bioenergy 34, 588–601
Euler M, Hoffmann MP, Fathoni Z, Schwarze S, 2016. Exploring yield gaps in smallholder oil palm production systems in eastern Sumatra, Indonesia. Agricultural Systems 146, 111–119.
FAOSTAT, 2019. Crops and livestock trade database. www.faostat.fao.org
Forestwatch, 2019. Oil Palm distribution area. https://www.globalforestwatch.org/about
Grassini, P., Rattalino Edreira, J.I., Andrade, J.F., van de Ven, G., Hekman, W., van den Beuken, R., van Ittersum, M.K., Rahutomo, S., Sigit Sutarta, E., Agus, F., Oberthur, T., Slingerland, M. Developing an atlas of yield potential and yield gaps for current oil palm plantation area in Indonesia. International Oil Palm Conference (IOPC), Medan, Indonesia 17-19 July 2018.
Hekman, W., Slingerland, M., van den Beuken, R. , van de Ven, G., Grassini, P., Andrade, J.F., Rattalino Edreira, J.I., Rahutomo, S., Sigit Sutarta E., Agus, F. Estimating yield gaps in oil palm in Indonesia using PALMSIM to inform policy on the scope for intensification. International Oil Palm Conference (IOPC), Medan, Indonesia 17-19 July 2018.
Hoffmann, M. P., Vera, A. C., Van Wijk, M. T., Giller, K. E., Oberthür, T., Donough, C., & Whitbread, A. M. (2014). Simulating potential growth and yield of oil palm (Elaeis guineensis) with PALMSIM: Model description, evaluation and application. Agricultural Systems, 131, 1-10.
Indonesian Centre for Agricultural Land Resource Research Development (ICALRD). 2012. Indonesian Soil Map Scale 1:250.000. ICALRD-IAARD, Ministry of Agriculture of Indonesia, Bogor-Indonesia Indonesian National Statistics. 2018. Statistical Yearbook of Indonesia. BPS-Statistics Indonesia. (https://bbsdlp.litbang.pertanian.go.id/ind/index.php/layanan-mainmenu-65/produk/531-peta-tanah1).
Jelsma, I., Schoneveld, G.C., Zoomers, A. and van Westen, A.C.M., 2017. Unpacking Indonesia's independent oil palm smallholders: An actor-disaggregated approach to identifying environmental and social performance challenges. Land Use Policy, 69: 281-297.
Molenaar JW, Persch-Ort M, Lord S, Taylor C, Harms J, 2013. Oil Palm Smallholders—Developing a Better Understanding of Performance and Potential. International Finance Corporation-World Bank, Jakarta.
NASA, 2012. NASA-Agroclimatology methodology. Available at: http://power.larc.nasa.gov/common/AgroclimatologyMethodology/Agro1d0
Get access to the Atlas for advanced users
Download GYGA results
| Please read the license information in case you are interested in using the data from the Global Yield Gap Atlas. | |
| read more>> |
 Country staff
| Name | Affiliation | Picture below |
| Coordinator |
|
|
| Dr. Suroso Rahutomo | Soil Science and Agronomy Researcher Department - IOPRI | 1 |
| Country Agronomists |
| |
| Fahmuddin Agus | Indonesian Center for Agricultural Land Resources Research and Development (ICALRRD) | 2 |
| Dwi Kuntjoro | ICALRRD | 3 |
| Dr. Heri Santoso | Soil Science and Agronomy Researcher Department - IOPRI | 4 |
| Dr. Edy Sigit Sutarta | Soil Science and Agronomy Researcher Department - IOPRI | 5 |
| Dr. Winarna | Soil Science and Agronomy Researcher Department - IOPRI | 6 |
| Dhimas Wiratmoko, M.Sc. | Soil Science and Agronomy Researcher Department - IOPRI | 7 |
| Fandi Hidayat, M.Sc. | Soil Science and Agronomy Researcher Department - IOPRI | 8 |
| Iput Pradiko, S.Si. | Soil Science and Agronomy Researcher Department - IOPRI | 9 |
| Muhdan Syarovy, S.P. | Soil Science and Agronomy Researcher Department - IOPRI | 10 |
| Muhayat, S.P. | Staff of Service and Consultation - IOPRI | 11 |
| Ratnawati Nurkhoiry, M.Si. | Socio Techno Economy Researcher Department - IOPRI | 12 |
| Zulfi Prima Sani Nasution, S.P. | Socio Techno Economy Researcher Department - IOPRI | 13 |
| Rana Farrasati, S.P. | Soil Science and Agronomy Researcher Department - IOPRI | 14 |
| Imbransya Ali Harahap, S.P. | Soil Science and Agronomy Researcher Department - IOPRI | 15 |
| Dr. Sachnaz Desta Oktarina | Socio Techno Economy Researcher Department - IOPRI | 16 |