 Rice production in nine Sub-Saharan African countries
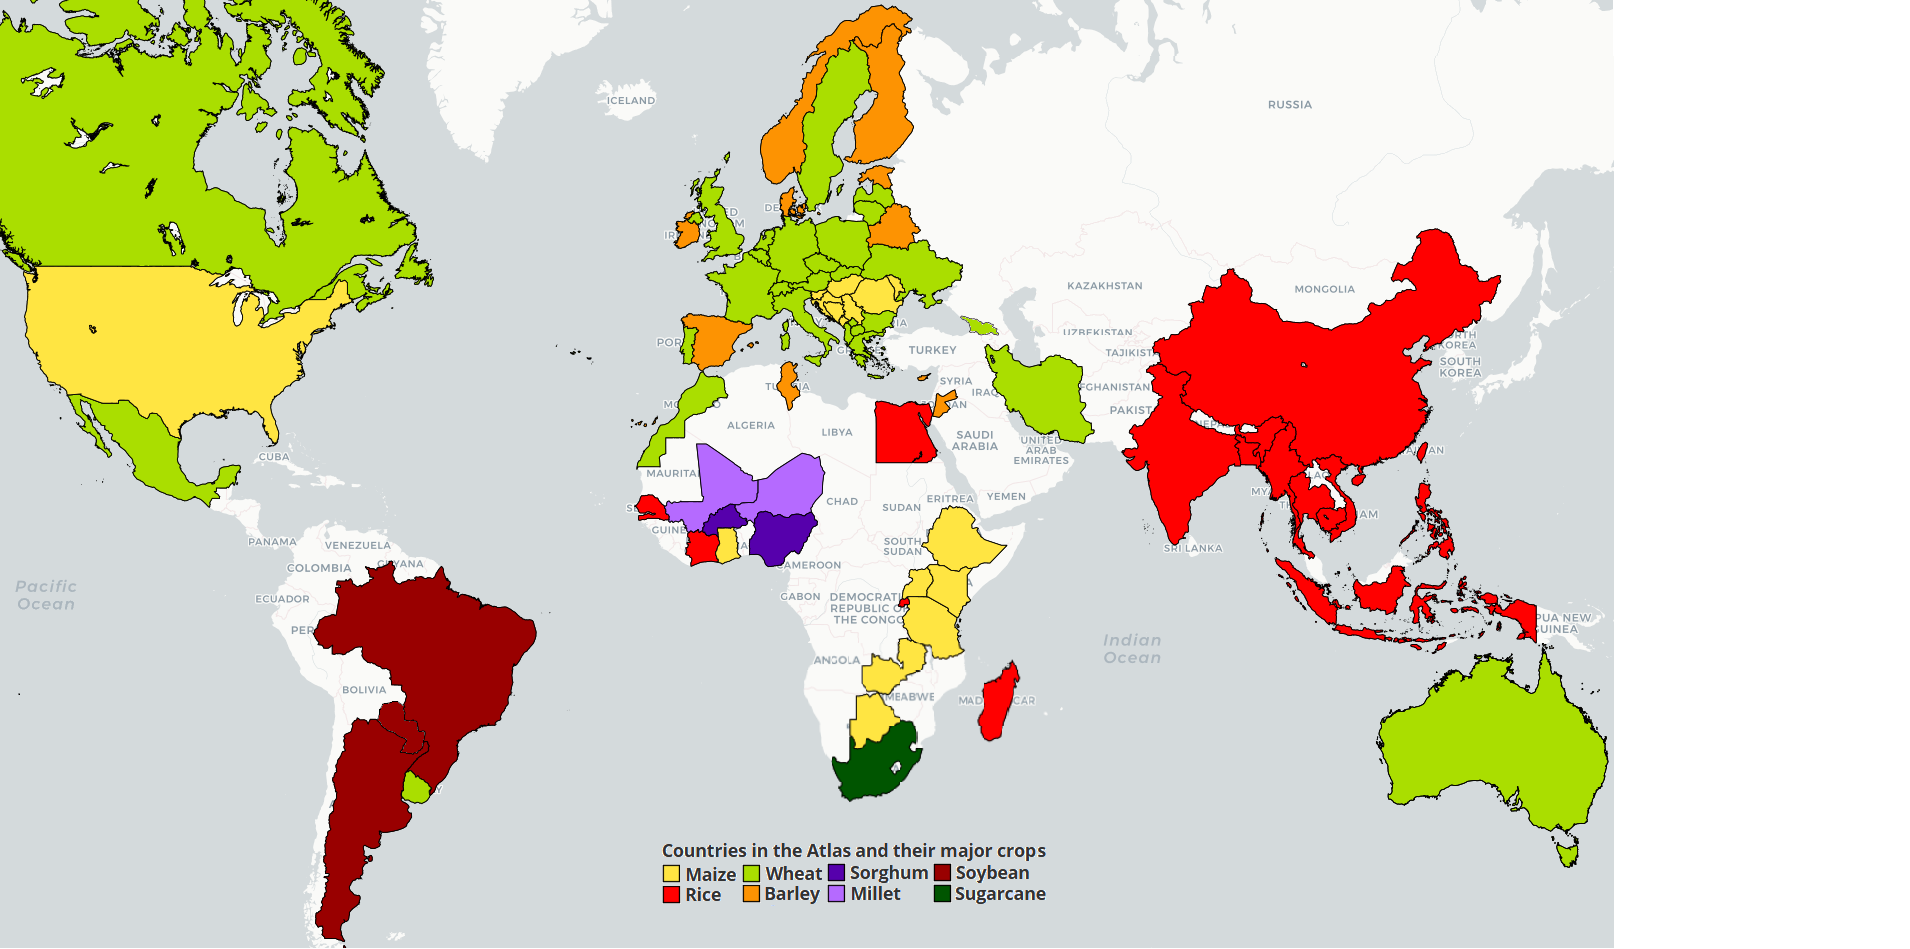
Countries: Mali, Burkina Faso, Ghana, Niger, Nigeria, Ethiopia, Uganda, Tanzania and Zambia
Sub-Saharan Africa (SSA) accounts for 6% and 26% of global total rice production and harvested area, respectively (FAOSTAT, 2022). Rice is the second most important source of calories and a strategic crop for food security in many SSA countries (Seck et al., 2012). Ten SSA countries (Burkina Faso, Ethiopia, Ghana, Kenya, Mali, Niger, Nigeria, Tanzania, Uganda, and Zambia) account for a respective 37% and 19% of the regional total rice production and harvested area in SSA (FAOSTAT, 2022). Most of the rice producing areas in SSA region have a tropical climate. Due to population growth, increasing household incomes, urbanization, and changes in food consumption patterns and preferences, demand for rice in SSA is growing at a higher increase rate than for any other staple crop (Djurfeldt, 2015; Nigatu et al., 2017). Average annual production, harvested area, and average yield per harvested area for each of the ten SSA countries are shown in Table 1. Also shown is the percentage of harvested areas of rainfed rice.
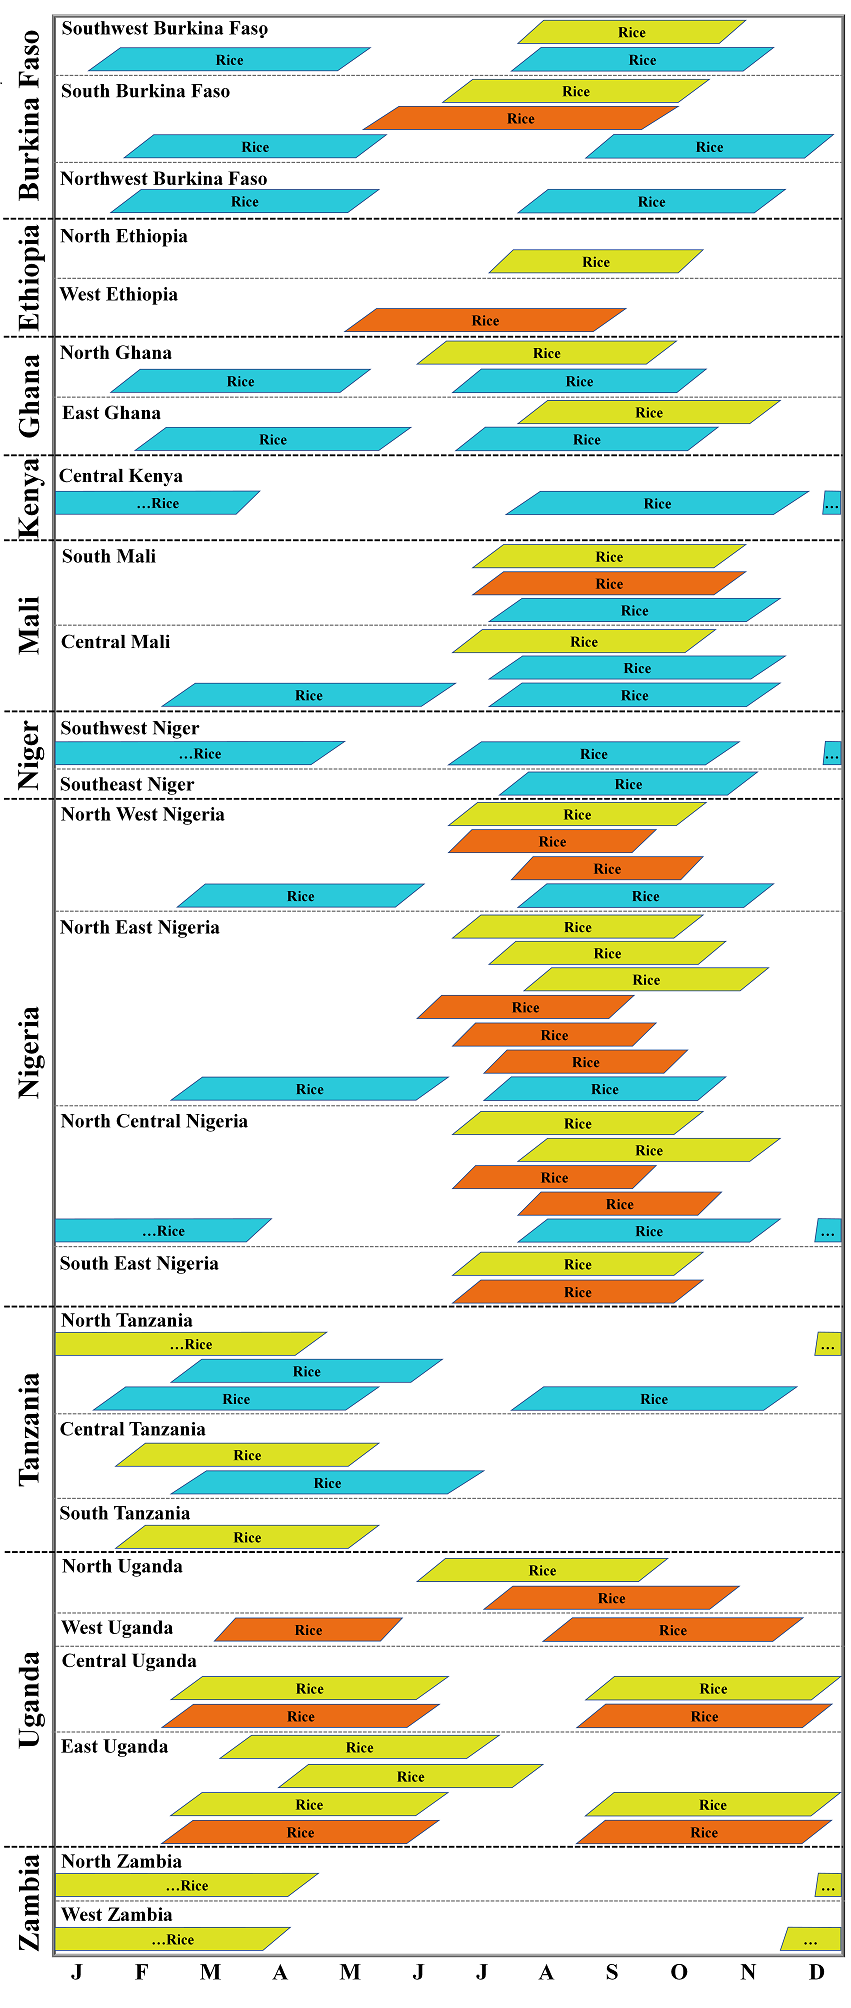
Cropping systems are very diverse in these ten SSA countries, including different ecosystems (upland and lowland) and water regimes (rainfed and irrigated). In our assessment for the 10 countries, we included irrigated, rainfed lowland, and rainfed upland rice cropping systems depending on their share of total rice area in each country. Single- and double-season rice are both practiced in rice production in SSA. Rice crop calendars are shown for different regions in each country (Figure 1).
Table 1. National average total rice production, harvested area, and average yield for Burkina Faso, Ethiopia, Ghana, Kenya, Mali, Niger, Nigeria, Tanzania, Uganda, and Zambia between 2016 and 2020. Also shown is the percentage of area under rainfed conditions, including both lowland and upland environments Source: FAOSTAT, 2022 (https://www.fao.org/faostat/en/#data/QCL); You et al., 2014.
| Country | Total production (thousand ton) | Harvested area (thousand ha) | Average yield (t/ha) | Rainfed rice (as % of total rice area) |
| Burkina Faso | 367 | 171 | 2.14 | 92 |
| Ethiopia | 164 | 57 | 2.87 | 99 |
| Ghana | 815 | 285 | 2.85 | 82 |
| Kenya | 127 | 28 | 4.66 | <1 |
| Mali | 2972 | 879 | 3.39 | 37 |
| Niger | 124 | 28 | 4.37 | 100 |
| Nigeria | 8080 | 5409 | 1.50 | 99 |
| Tanzania | 3220 | 1162 | 2.77 | 93 |
| Uganda | 212 | 77 | 2.76 | 42 |
| Zambia | 34 | 26 | 1.31 | 62 |

Figure 1. Dominant rice cropping systems in Burkina Faso, Ethiopia, Ghana, Kenya, Mali, Niger, Nigeria, Tanzania, Uganda, and Zambia. Boxes show approximate crop cycle length (from establishment to harvest maturity). Blue, yellow, and orange colors indicate irrigated, rainfed lowland, and rainfed upland rice, respectively.
Selection of buffers and reference weather stations
SPAM (Spatial Production Allocation Model; https://www.mapspam.info/) maps, together with expert knowledge from colleagues from Africa Rice Center (AfricaRice) and national partners, were used to identify the rice harvested area, separately for irrigated and rainfed rice (You et al., 2009, 2014). Following van Bussell et al (2015), a total of 24 and 34 buffers were selected for irrigated and lowland rainfed rice in these five countries, respectively (Figure 2).
Measured weather data for the most recent 20 years (2000-2019) of daily weather data were available for 38% of selected weather stations and their buffer zones. Weather data used in simulation included daily solar radiation, maximum and minimum temperatures, precipitation, vapor pressure deficit, and wind speed. Weather data for selected weather station were subjected to quality control measures to fill in missing data and identify and correct erroneous values. In the case of those stations with only few years of weather data (60% of cases), we generated long-term weather records based on correlations between measured weather data and NASA-POWER maximum and minimum temperatures (Van Wart et al., 2015). In the case of solar radiation and rainfall, we used data from NASA-POWER without any correction (NASA, 2022). In the case of buffers without measure weather data at all (2%), we used uncorrected NASA-POWER uncorrected data for all meteorological variables needed for crop modeling.

Figure 2. Selected buffers in Burkina Faso, Ethiopia, Ghana, Kenya, Mali, Niger, Nigeria, Tanzania, Uganda, and Zambia. Blue and yellow circles represent weather stations for irrigated rice and rainfed rice, respectively. Distribution of rice harvested area is shown in green (You et al., 2014).
Crop management data and modeling
Crop management practices for each buffer were retrieved through agronomists from AfricaRice and national agricultural research institutes and extension agents. Requested information included: dominant crop sequences, ecosystems (upland/lowland), water regime (rainfed/irrigated) and proportion of each of them to the total harvested area, crop establishment method (transplanted/direct-seeded), average sowing/transplanting dates, and dominant cultivar name and maturity. Reported dates of establishment (either direct seeding or transplanting) in the Atlas correspond to dominate establishment date of each cropping system in each region reported by local agronomists and extension agents.
Simulations of yield potential (or water-limited yield potential of rainfed rice) of rice varieties for each region were performed using ORYZA v3 (Li et al., 2013, 2017). To the extent that it was possible, we attempted to simulate varieties with broad adaptability that are (or were) widely grown these countries, but genetic coefficients derived from well-managed experiments for these varieties were not available. Hence, generic crop parameters of rice varieties in SSA were retrieved from previously published studies (van Oort et al., 2011, 2015; van Oort and Dingkuhn, 2021; van Oort and Zwart, 2017). Briefly, in these previous studies, ORYZA2000 was used to derive the genetic parameters of rice varieties by adjusting crop phenology to match reported dates of maturity and using reported values for a widely cultivated variety (IR72) for other crop coefficients.
For irrigated rice, we assumed no water limitation, while simulation of rainfed lowland and upland rice considered precipitation and soil properties influencing the soil water balance. For rainfed simulations, we assumed a bund height of 25 cm and puddled clay loam soil (irrigated), non-puddled clay loam (rainfed lowland), and non-puddled sandy loam soil (upland rice). There is high uncertainty in relation with groundwater depth across sites, seasons, and landscapes, and its influence on lowland rainfed rice yields (Boling et al., 2008; van Oort and Zwart, 2017). Given the range of possible scenarios and associated uncertainties, we simulated water-limited yield potential for rainfed lowland rice for two scenarios of groundwater depth during the crop cycle (shallow [40 cm], medium [75 cm], and deep [100 cm]). We also assumed that each groundwater scenario accounts for an equal (50: 50) share of the rainfed lowland rice area in each buffer. For rainfed lowland rice, the two scenarios basically portray non-water limitation (shallow) and drought-prone (deep) environments. In the case of upland rice, we assumed groundwater depth during the entire crop cycle at 1 m.
For each buffer-year-crop-water regime combination, each crop cycle (in each sequence) x soil type combination was simulated, and then weighted by their relative proportion to retrieve an average yield potential for each buffer zone. The yield gap was calculated as the difference between the yield potential (or water-limited yield potential for rainfed rice) and average on-farm yield. Data on average farmers’ rice yields were collected from previous publications and local agronomists (Table 2). Simulated yield, actual yields, and yield gaps are all reported at a standard moisture content of 14%.
Table 2. Sources of data on average farmer rice yields for Burkina Faso, Ethiopia, Ghana, Kenya, Mali, Niger, Nigeria, Tanzania, Uganda, and Zambia.
| Country | Data source |
| Burkina Faso | AfricaRice, RiceAdvice; AfricaRice, Rice Statistics database; Nakano et al., 2011 |
| Ethiopia | ADCA |
| Ghana | AfricaRice, RiceAdvice; AfricaRice, Rice Statistics database; Japan International Cooperation Agency (JICA); Dossou-Yovo et al., 2020; Abdul-Ganiyu et al., 2012 |
| Kenya | Kenya National Bureau of Statistics (KNBS) |
| Mali | AfricaRice, RiceAdvice; AfricaRice, Rice Statistics database; JICA; Dossou-Yovo et al., 2020 |
| Niger | GYGA country agronomist |
| Nigeria | AfricaRice, RiceAdvice; AfricaRice, Rice Statistics database; AfricaRice field survey |
| Tanzania | GYGA country agronomist; Statistics Unit-Ministry of Agriculture, Food Security and Cooperatives; AfricaRice field survey |
| Uganda | AfricaRice, Rice Statistics database |
| Zambia | GYGA country agronomist |
References
Boling AA, Tuong TP, Suganda H, Konboon Y, Harnpichitvitaya D, Bouman BAM, Franco DT. The effect of toposequence position on soil properties, hydrology, and yield of rainfed lowland rice in Southeast Asia. Field Crops Research, 2008, 106: 22-33.
Djurfeldt AA. Urbanization and linkages to smallholder farming in sub-Saharan Africa: Implications for food security. Global Food Security, 2015, 4: 1-7.
FAOSTAT. Statistical Database. https://www.fao.org/faostat/en/#data/QCL. 2022. Accessed on April 10, 2022.
Li T, Angeles O, Marcaida M, Manalo E, Manalili M P, Radanielson A, Mohanty S. From ORYZA2000 to ORYZA (v3): An improved simulation model for rice in drought and nitrogen-deficient environments. Agricultural and Forest Meteorology, 2017, 237: 246-256.
Li T, Raman AK, Marcaida M, Kumar A, Angeles O, Radanielson AM. Simulation of genotype performances across a larger number of environments for rice breeding using ORYZA2000. Field Crops Research, 2013, 149: 312-321.
NASA. NASA-Agroclimatology methodology. Available at: https://power.larc.nasa.gov/data-access-viewer/. 2022. Accessed on April 10, 2022.
Nigatu G, Hansen J, Childs N, Seeley R. Sub-Saharan Africa is projected to be the leader in global rice imports. United States Department of Agriculture Economic Research Service, No. 1490-2017-3240, 2017.
Seck PA, Diagne A, Mohanty S, Wopereis M. Crops that feed the world 7: Rice. Food Security, 2012, 4: 7-24.
van Bussel LG, Grassini P, Van Wart J, Wolf J, Claessens L, Yang H, Boogaard H, de Groot H, Saito K, Cassman KG, van Ittersum MK. From field to atlas: upscaling of location-specific yield gap estimates. Field Crops Research, 2015, 177: 98-108.
van Oort PA, de Vries ME, Yoshida H, Saito K. Improved climate risk simulations for rice in arid environments. PloS One, 2015, 10: e0118114.
van Oort PA, Dingkuhn M. Feet in the water and hands on the keyboard: A critical retrospective of crop modelling at AfricaRice. Field Crops Research, 2021, 263: 108074.
van Oort PA, Zhang T, De Vries ME, Heinemann AB, Meinke H. Correlation between temperature and phenology prediction error in rice (Oryza sativa L.). Agricultural and Forest Meteorology, 2011, 151: 1545-1555.
van Oort PA, Zwart SJ. Impacts of climate change on rice production in Africa and causes of simulated yield changes. Global Change Biology, 2017, 24: 1029-1045.
van Wart J, Grassini P, Yang H, Claessens L, Jarvis A, Cassman KG. Creating long-term weather data from thin air for crop simulation modeling. Agricultural and Forest Meteorology, 2015, 209: 49-58.
You L, Wood S, Wood-Sichra U, Wu W. Generating global crop distribution maps: From census to grid. Agricultural Systems, 2014, 127: 53-60.
You L, Wood S, Wood-Sichra U. Generating plausible crop distribution maps for Sub-Saharan Africa using a spatially disaggregated data fusion and optimization approach. Agricultural Systems, 2009, 99: 126-140.
Get access to the Atlas for advanced users
Download GYGA results
 | Please read the license information in case you are interested in using the data from the Global Yield Gap Atlas. |
| read more>> |

